Accounts Dashboard
The new dashboard provides a comprehensive overview of account activity that spans the past year up to today.
This new and powerful dashboard displays the total number of tests taken, unique test takers, recent test activity, and overall usage. You can even track the history of activities that have taken place within your account. As an added benefit, we have included a feedback widget, enabling users to share their concerns and suggest additional data points to include.
We have introduced the following widgets :
Total Tests
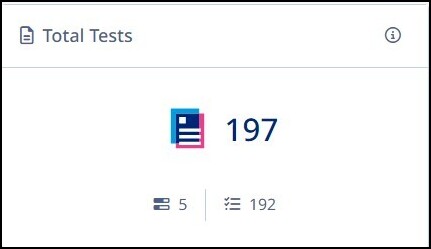
The widget offers an overview of test activity, showcasing the total number of tests created within the past year. It also highlights tests that are currently being taken or have been completed by test takers, either today or within the past year.
 Please note – This doesn’t include tests where test-takers are invited in the last 1 year.
Please note – This doesn’t include tests where test-takers are invited in the last 1 year.Total Test takers
The widget provides information on the total number of test takers who are either in progress or have completed the test, today or within the past year.
Please note – This doesn’t include invited test-takers Recent Tests
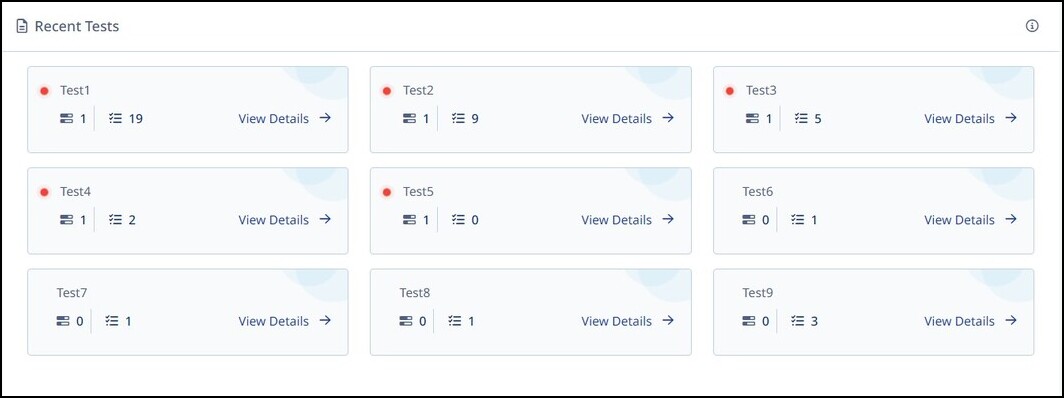
Recent tests display tests which are:
i. In progress- at least one test taker is currently taking the test.ii. Completed- tests where at least 1 test-taker has recently completed a test. This shows tests in descending order of test-taker finish time.
Usage Summary
Usage summary shows the total number of test-takers who have completed the test in this month + last 12 months.
This graph has three variations:
i. Total test-takersThis shows total test-takers who have completed the tests in the selected time range of weeks, months or days.
ii. Proctored testsThis shows the breakdown of completed test-takers between proctored and non-proctored test-takers. in the selected time range of weeks, months or days.
iii. Completion RatioThis gives the ration of test-takers who were invited vs those who have completed the test. The time range for these test-takers is based on the invitation date.
Please note – this will not include test takers who have not been invited. iv. Time range filter
There are three optionsa. Month – this displays the test-taker counts by grouping into months. The graph will include this month and last 12 months.b. Week – This displays the test-taker counts by grouping into weeks.c. Days- This displays test-taker counts for each day.
Activity Log
This is displayed for team admin users and will show the latest 25 activities across multiple sub-users.
Activity Log
This is displayed for team admin users and will show the latest 25 activities across multiple sub-users.
Feedback
This widget can be used to share feedback of the dashboard. Users can also share their requirements for additional data points to be included in the dashboard.